The end of New START and what the world’s nuclear arsenal could do.
🎧 Available in audio
Hello there. Last week saw the expiry of the USA-Russia New START (STrategic Arms Reduction Treaty) which limited the number of nuclear weapons in each country’s stockpile. This is pretty universally regarded as a bad thing, since it will lead to increases not only in the US and Russia’s stockpile of weapons, but also those of other countries.
I’ve written about nuclear war in these pages before, including a critical analysis of the idea that a nuclear exchange is an automatic world-ender (as argued, e.g., in Nuclear War: A Scenario by Annie Jacobsen).
In fact, I had a discussion recently with some friends and (don’t ask how) the topic of nuclear arms control and proliferation came up. One of them wondered why any country would need more than a single nuke, since “this is enough to end the world.”
This is very far from the truth—and thank God for that. I realised that this was a topic I needed to “unpack,” as the young people say. So, this week I’m going to look at various nuclear war scenarios and try to estimate (very roughly) what the worst-case scenario is. Spoiler alert: it’s bad. Really bad.
Before we start, let me encourage you to subscribe to the blog using the link below. As always, I’d love to see your comments below, or you can contact me via webform here or email here. Finally, if you’ve enjoyed this post, please share it with a friend.
If you enjoy this blog and want to support it, please consider a donation. Keeping this blog going doesn’t cost much, but it isn’t free either, so any help would be very much appreciated👍
Assumptions and caveats
Let me be very clear and unambiguous, lest I end up on some kind of watchlist: I don’t know anything classified or privileged about nuclear weapons. I served in the Irish military, but we are not a nuclear power. I have a (somewhat morbid) interest in nukes from a technical point of view and have found a scary amount of information on open sources. Nothing that I write here cannot be found online or surmised with a basic technical education.
With that out of the way, let’s talk about how I’m going to do this analysis. It’s going to be extremely high level. Here are some of my assumptions:
- Every nuclear power uses all of their deployed nuclear weapons. This is an all-out mutually assured destruction scenario, so countries throw everything including the kitchen sink at their opponents. On the other hand, they are also bound by the laws of physics. A warhead sitting in a storehouse somewhere rather than atop a missile or in a plane cannot be used (at least not against the enemy). This scenario is about a war that could break out tomorrow so we will restrict our analysis to deployed nuclear warheads.
- 3,800 warheads are launched or dropped. This is roughly the total number of deployed strategic nuclear warheads, as estimated by Our World in Data for 2025. Of these, roughly 1,700 each belong to Russia and the USA, with the remaining ~400 split between France, the UK, and China, in that order. India, Israel, North Korea, and Pakistan have about 1,000 warheads between them, but none are deployed and so could not contribute to tomorrow’s Armageddon. Likewise the 5,200 non-deployed warheads owned by the P5 countries above, of which most are owned the by Russia and the USA.
- Deployed warheads are launched indiscriminately. Of course this isn’t true. Each warhead will be meticulously targeted, but because it’s all-out war, I can assume that all countries are hit. Another (grimmer) way of looking at it is that every major city attracts a nuclear weapon. Similarly, I could break this down by country or by delivery system1, but I won’t. I’ll assume that countries with nukes target each other. In this way, the big cities of nuclear powers and their allies get sufficiently “covered” by enemy weapons. I discuss the cities in more detail in the next subsection.
- The yield of each warhead is 500 kt2. Okay, this is a big and gross assumption. Initially I was going to go for 200 kt, based on the weapons which form the majority of the US and Russian deployed stockpiles at present. But looking at Our World in Data’s figures for “estimated explosive power of nuclear weapons deliverable in a first strike,” puts the total destructive power of deployed warheads at 2,559 Mt (2,559,000 kt). However, this data is from 2010 (the latest year available, when there were a lot more warheads in the world), whereas their figures on numbers of deployed warheads (which I used above) are from 2025. The 2010 dataset includes 14 Mt of Pakistani and 7 Mt of Indian deployable destruction, whereas neither country has deployable warheads listed in 2025. Using the 2010 Megatonnage totals divided by the 2025 deployed warhead totals gives 670 kt per warhead, but that almost certainly uses an artificially small denominator. I’m going to settle on 500 kt as a compromise. Much bigger than the deployed US and Russian nukes, but smaller than the whopper 12 x 1 Mt MIRVs on the Chinese Dongfeng 5.
- Half of nukes are designated for military targets, i.e. “counterforce” strikes. The other half target cities, i.e. “countervalue” strikes. I’ll try to estimate the casualties from the countervalue strikes and will use a fudge factor to add in the casualties from counterforce strikes. I’m also discounting deployed tactical nuclear weapons from this analysis as I assume they will be used for counterforce strikes. Besides, Our World in Data estimates that there are only 100 deployed, by the USA.
- 15% of weapons are destroyed before launch in counterforce strikes. A big part of nuclear strategy involves destroying your enemy’s weapons before they leave the ground. I’m assuming that this is an all-out, MAD, launch-on-warning exchange of weapons. As such, countries manage to get 85% of their weapons aloft before they are destroyed. This is probably conservative (i.e. more would be destroyed in real life), but I’m assuming some pretty nifty decision-making because I don’t want to go down a rabbit hole of national command and control differences.
- Weapons which are launched have an end-to-end failure rate of 15%. This estimate might be slightly on the high side, so it might help address the balance with my last assumption. End-to-end includes a failure of the delivery system (e.g. missile malfunction or plane unable to reach target) as well as failures to fuze, arm, and fire the weapon. I’m including the likelihood of interception in this failure rate, given how few interceptor missiles are actually deployed and how hit-or-miss they are.
The target list
I’ve made some very crude assumptions3 about how many cities are hit. I started out with the idea of going down this list of the world’s biggest cities and allocating nukes to each one based on whether it was in a country which was a nuclear power, or an ally of one, or otherwise “exposed” to strategic attack. I haven’t gone down that road. In part, it seemed a bit morbid, even by my standards, and I don’t have the knowledge, expertise, or time to re-create a universal nuclear operations plan. If you want to see what one looked like, then check out the de-classified 1950s US Air Force priority list for targets in the USSR and its allies.
Instead I’ve used the NUKEMAP website by Alex Wellerstein to estimate the casualties from a 500 kt airburst weapon at a sample of twelve cities which would be targeted in a nuclear war (I’ve taken the top 12 cities from Wikipedia’s list of world’s largest urban areas, picking only those that “belong” to a nuclear power or close ally). Then I’ve averaged the figures and multiplied by the total number of warheads.
Is this crude? Yes, very. And, it turns out, every bit as morbid as my original idea. One adjustment I made was for multiple warheads targeting the same city. The de-classified 1950s plan I mentioned above shows that Moscow had 178 distinct ground zeroes. Leningrad (St. Petersburg) had 145 and East Berlin had 68. Each of these is assigned to a specific type of military-industrial target (the place names or coordinates are not shown). Chillingly, there is one target for “Population” in each of these lists:

So, how can I account for this? When a hundred warheads hit a single city, the casualty effect is obviously less than if those hundred warheads hit one hundred different big cities. Conversely, the effect is still more than if the hundred nukes hit a hundred individual villages. Additional “ground zeroes” will cause more casualties in an already hit city by:
- Bringing a new section of the city into the area of most destruction. You would expect to see this in a “one-on-one” engagement, but in the total war scenario I’m describing, there will also be a lot of overlap.
- A second or subsequent blast killing people who were already injured by the first one. Similarly, destroying buildings which had been damaged, thus killing more people.
I was going to apply a fudge factor correction coefficient to the total result to account for this uncertainty and overlap effect. My initial idea was that 25% would be reasonable, and I felt that this was a little bit conservative. As we’ll see in the next section with the results, I was miles off. I told you that my methods were crude.
The damage
The first thing to look at is the NUKEMAP results for the twelve sample cities. These are, in descending order of size:
| City | Urban population (2025, UN) | NUKEMAP estimated casualties | NUKEMAP estimated injuries | NUKEMAP inside 1 psi4 |
|---|---|---|---|---|
| Tokyo | 33,412,512 | 997,050 | 3,374,080 | 9,993,527 |
| Delhi | 30,222,405 | 1,643,580 | 4,949,490 | 14,250,380 |
| Shanghai | 29,558,908 | 2,530,870 | 4,047,670 | 10,817,141 |
| Manila | 24,735,305 | 1,698,490 | 4,164,360 | 11,915,636 |
| Seoul | 22,490,482 | 988,090 | 3,660,560 | 10,692,582 |
| Karachi | 21,422,590 | 1,391,640 | 3,669,020 | 10,413,646 |
| Istanbul | 15,014,763 | 1,025,670 | 2,783,330 | 7,460,448 |
| Moscow | 14,524,753 | 782,660 | 2,804,070 | 8,294,949 |
| New York City | 13,920,148 | 1,299,380 | 2,477,590 | 7,242,796 |
| London | 10,416,420 | 707,650 | 1,881,510 | 5,451,189 |
| Paris | 9,381,921 | 1,239,740 | 2,381,690 | 6,700,300 |
| Tehran | 9,174,964 | 1,708,420 | 3,434,070 | 9,128,838 |
| Averages | 19,522,931 | 1,334,437 | 3,302,287 | 9,363,453 |
Note that I’ve only picked one city from each “power”, e.g. there are many more Asian cities that rank above the likes of New York City or London in size, but I wanted to get a representative sample. I think we can all expect these to get targeted.
I should also point out that it goes against my instincts to put the figures in like they are in table above, exact to a single whole number. I wouldn’t want you to think that this is any way precise, and Alex Wellerstein states as much in his disclaimer for the NUKEMAP tool. I’ve chosen to put the figures in as they come from the tool because:
- It’s easier than rounding them all to the nearest 100k
- So you can try for yourself5 and compare with the figures I got
That caveat aside, let’s look at what the averages tell us. A 500 kt nuclear weapon detonated in airburst above a megacity will affect 9.3 million people, killing 1.3 million and injuring a further 3.3 million.
To put those numbers into perspective, here’s what the damage map looks like for New York City, where the number of deaths is right on the mega-city average of 1.3 million:

To give you some idea of what people would endure here, Alex Wellerstein has included the expected effects at each radius (copied from the website, link above):
- Inside the 1 psi circle (the outermost one): Glass windows can be expected to break. This can cause many injuries in a surrounding population who come to a window after seeing the flash of a nuclear explosion (which travels faster than the pressure wave). Often used as a benchmark for light damage in cities. This circle covers basically all of Manhattan and Brooklyn, as well as parts of the other boroughs and New Jersey, extending as far as Newark Airport.
- Inside the thermal radiation radius (the larger orange circle): Third degree burns extend throughout the layers of skin and are often painless because they destroy the pain nerves. They can cause severe scarring or disablement and can require amputation. This circle covers Manhattan as far as the top of Central Park, Jersey City, and extends into Brooklyn.
- Inside the 5 psi (moderate blast damage) radius (the smaller grey circle): most residential buildings collapse, injuries are universal, fatalities are widespread. The chances of a fire starting and commercial and residential damage are high, and buildings so damaged are at high risk of spreading fire. Often used as a benchmark for moderate damage in cities. This circle covers all of Midtown and Lower Manhattan.
- Inside the fireball radius (the small orange circle): Maximum size of the nuclear fireball. Anything inside it is effectively vaporized. This covers an area of about two square kilometres or 810 metres radius.
If you want a truly gruesome description of a nuclear blast, read Annie Jacobsen’s Nuclear War: A Scenario.
The problem with my method
The more mathematically minded of you will have spotted the problem with my method right away. If we average 1.3 million casualties per nuke, and we have about 1,400 nukes reaching their targets (after making the adjustments in the “assumptions” section above), then we have 1.3 billion casualties, 3.4 billion injuries, and nearly 10 billion people inside the 1 psi blast radius.
This is quite a lot more than the world population of 8.3 billion (as of Feb 2026), of whom 55% live outside cities and wouldn’t be affected by our horror map radii. I have to change my fudge factor correction coefficient from its original 25% to about 80% for the numbers to start making sense: 2.6 billion people affected, with 370 million deaths and 910 million injuries.
There’s a better way to do this.
A simpler (and therefore better) way
Rather than coming up with fantasy numbers which turn out bigger than the total urban population, let’s start with that latter figure and figure out what, in a truly worst-case scenario, the maximum number of casualties would be.
The UN have estimated how many of the world’s 8.2 billion people (as of 2025) lived in cities, towns, and rural areas. For cities, it’s broken down by “megacities” (33 of them), “large cities” (43), and so on down to almost 10,000 “very small” cities:

I picked a few sample cities6 and did the same NUKEMAP analysis to get average number of casualties in each. I also simplified the assumptions a bit. Rather than just looking at nuclear powers and their allies, I decided to include all cities. After all, I’m looking at the worst-case scenario. For the same reason, I assumed that all deployable warheads were now targeting cities (countervalue, remember) as opposed to counterforce, and also removed the “15% will be destroyed before launch” assumption. I kept the 15% failure rates though.
I assumed that each subsequent strike on a city resulted in 50% fewer casualties than the one before. Still a rough assumption. I put the figures into Excel and worked out how many warheads would be assigned to each type of city to maximise overall casualties.
Remember my aspiration to not be morbid? Yeah, that ship has long since sailed. The grim results are below.
| Type of city | Share of world population | Number of cities | Population (millions) | # weapons per city | Total casualties (millions) |
|---|---|---|---|---|---|
| Megacities (> 10 million) | 7.60% | 33 | 623 | 10 | 91 |
| Large cities (5-10 million) | 4.00% | 49 | 328 | 5 | 107 |
| Medium cities (1-5 million) | 10.70% | 429 | 877 | 2 | 298 |
| Small cities (< 1 million) | 10.20% | 1,822 | 836 | 1 | 247 |
| Very small cities (<250k) | 12.20% | 9.807 | 1,000 | N/A, all expended | 0 |
| Not living in cities | 55.30% | N/A | 4,535 | 0 | |
| Total | 100% | 12,140 | 8,200 | 3,233 in total | 743 |
The grim toll is 743 million killed, with an unknown (but probably much larger) number injured or otherwise affected. The people living in medium cities7 seem to have the highest casualties as a share of average city size, but no-one comes out of this doing well.
Conclusion: I told you this would be bad.
What was the point of all this modelling? I hadn’t intended to go into this much detail, but I did my usual thing which was to run down an Excel rabbit hole. What I take away from it is that the current stock of deployed nuclear weapons in the world is enough to kill close to 1 billion people and significantly damage or destroy every city larger than 250,000 people.
In reality, I doubt that any country’s nuclear plan involves targeting random cities that bear no ill will toward said country. I doubt that the USA is targeting Abuja, for example, or that Russia has a warhead trained on Peshawar. So a real all-out nuclear exchange would involve more weapons on some cities and fewer or none on others. The total number of casualties might be lower, but I doubt by a meaningful amount8.
By way of comparison, an upper estimate of 75 million people died in World War II. This hypothetical World War III would kill ten times that number, or three times more as a portion of global population. The final total would be much higher, of course, due to radiation sickness, radioactive fallout and lingering injuries.
I told you this would be bad. It’s not a world-ender, but that’s of little consolation. If anything, it makes it scarier. Nuclear war isn’t some fate which will end the human race in an instant, snuffing us out like a supernova or asteroid impact. Instead, it would lead to a terrible loss for billions, long and lingering suffering for many more, and permanent psychological scarring for many others, if not everyone else. A fight “to the pain,” if you will, rather than “to the death.”
I’m sorry, but it gets worse. This scenario was modelled based on nuclear weapon stockpiles which, as of 2025, are the smallest they’ve been since 1958:

The expiration of New START will lead to a reversal in this trend and increases in stockpiles. The Federation of American Scientists have warned about the likely consequences of this:
While defense hawks in Russia and the United States claim that more nuclear weapons are needed for national security, doing so would inevitably result in each country being targeted by hundreds of additional nuclear weapons.
—The Aftermath: The Expiration of New START and What It Means For Us All, FAS, 5th Feb 2026
As my (admittedly very basic) modelling here shows, the global nuclear powers already have more than enough deployed weapons to destroy each other already with enough left over to cause catastrophic effects on many third countries.
I was hoping to use this article to talk in a bit more detail about the proliferation risk, nuclear testing, and the logic that underpins increasing the stockpile of nuclear weapons, but that will have to wait until another day.
In the meantime, if you want to learn more about nuclear weapons, read the “fact vs. fiction” explainer which I wrote just over a year ago. If you are at a loss about the logic behind why anybody would build one, let alone thousands of these awful weapons, then check out my post on mutually assured destruction (MAD). If you want a more in-depth, academic, but still entertaining explanation of MAD, then Bret Devereaux’s article about Nuclear Deterrence 101 on ACOUP is definitely worth reading. Finally, if you want to see a limited nuclear war scenario, then check out this video from Ryan McBeth:
Thanks for reading and please remember, if you haven’t already, to subscribe using the link below. Please also share this article with a friend and help me broaden my reach. Every little helps! See you next week.
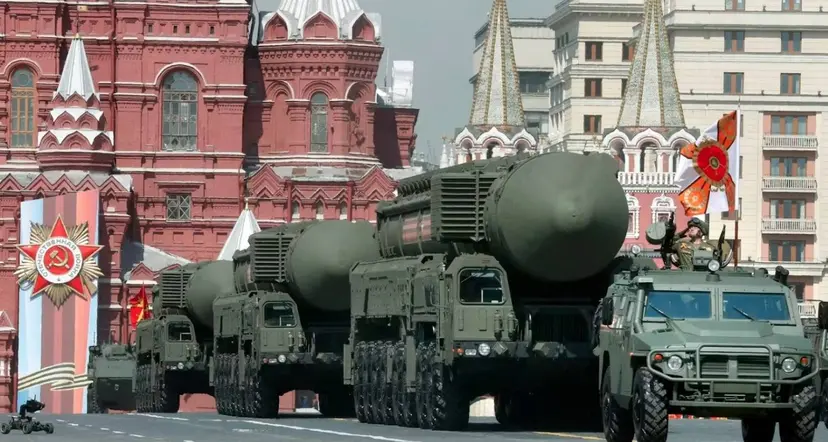
Cover picture: New Start’s expiration: Is the world less safe? via News Arena India
Fort Bragg 1st Brigade HQ. Jonas N. Jordan, U.S. Army Corps of Engineers, Public domain, via Wikimedia Commons
- Ballistic missiles, cruise missiles, air-dropped bombs, torpedoes, etc. ↩︎
- “kt” is shorthand for “kilotonne,” or “thousand tonnes.” This, in turn, is shorthand for “thousands of tonnes of TNT equivalent.” Nuclear weapons are so powerful that their “yields” (read: destructive power) is measured in thousands or millions (Megatonnes) of tonnes of TNT. ↩︎
- Everything in today’s article is crude. ↩︎
- 1 psi (about 1/15 bar in new money) is the threshold above which blast effects become noticeable (in a bad way). Think of glass breaking, very loud noise, etc. ↩︎
- The NUKEMAP tool, I mean! Please don’t compare using real-world data. ↩︎
- Mega: Tokyo, Delhi, Shanghai, Manila, Seoul, Karachi, Istanbul, Moscow; Large: Ho Chi Minh City, Buenos Aires, New York City, Lagos, London, Paris, Tehran, Kuala Lumpur; Medium: Nairobi, Kigali, Montreal, Dublin, Peshawar, Abuja; Small: Bonn, Strasbourg, Halifax, Cork. ↩︎
- A sobering thought, given that I live in one. ↩︎
- Of course it would be meaningful to the cities not targeted; I mean in the global sense. ↩︎
Leave a Reply to The DirectorCancel reply